DESIGNING AND DEPLOYING ENHANCED KPI MANAGEMENT IN APPIAN PROCESS MINING

Solutions and Hypothesis Proposal
This phase was all about defining and delivering the MVP for enhanced KPI management. We focused on validated learning through quick iterations and close collaboration with the product owner (Franziska Thiel), customer success (Jonas Bernien), and the dev team.
1. Initial Brainstorming & Ideation (Understanding the Problem Space)
We kicked things off with collaborative workshops involving UX designers, developers, Franziska as the product owner, and Jonas representing customer success. These sessions were all about exploring the problem space and generating initial concepts. We used design thinking approaches like user journey mapping and “How Might We” questions to frame the challenges.
Jonas’s insights about how Lana Labs users handled KPIs were crucial — he shared unmet user needs and common challenges, which helped us sharpen the focus on impactful features.
Key User Insights
Several essential insights came up during these workshops that shaped the MVP:
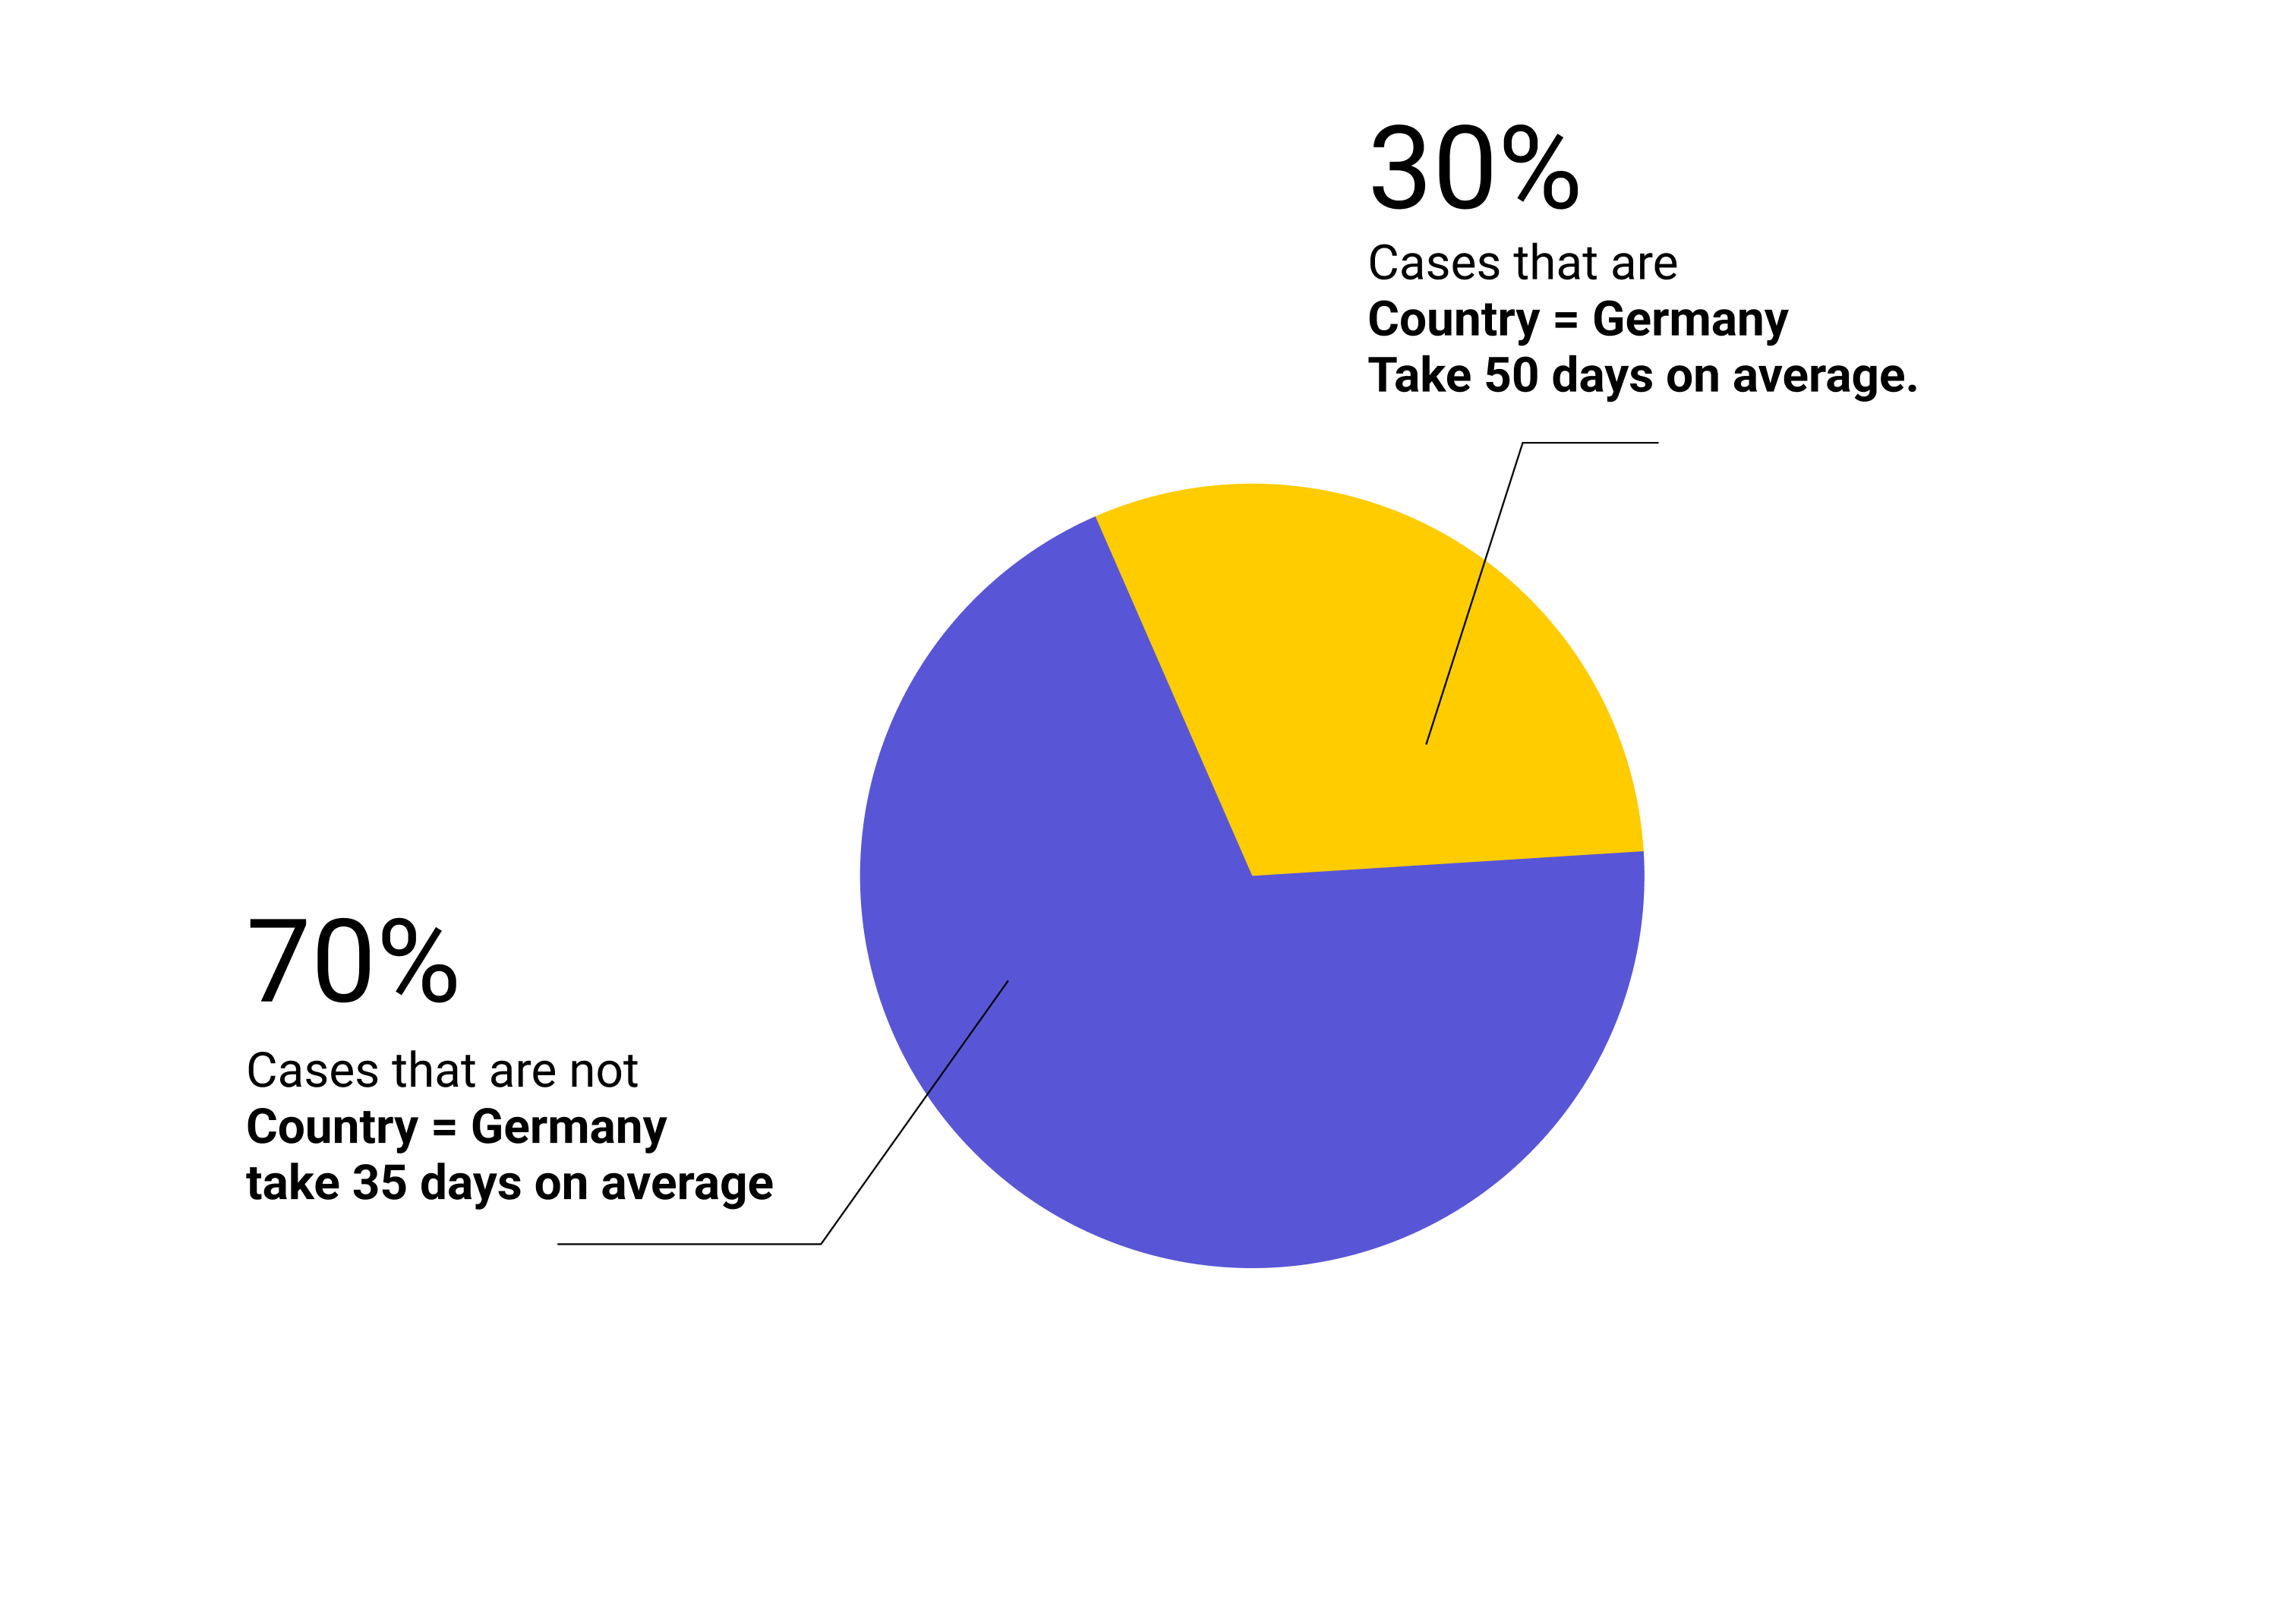
- Attribute-Based Analysis: Users needed to analyze metrics by attributes like location (e.g., “Why are the cases Germany slower than the rest of cases?”). This highlighted the demand for granular filtering options.
- Process Conformance: Users wanted to track and monitor activities to ensure compliance with set thresholds — pointing to a need for “Count” KPIs similar to SLA monitoring.
- AI-Driven Suggestions: Users expected intelligent KPI recommendations to reduce the manual effort in setup.
Initial Concepts Explored
- Dynamic Filtering: Filter KPI calculations by process attributes.
- Activity/Sequence Counting: Define KPIs to count occurrences of specific process events.
- AI-Powered KPI Suggestions: Explore potential for KPI recommendations based on data patterns.

2. MVP Definition (Hypotheses & Experiments)
Since building everything upfront wasn’t practical, we prioritized the core functionality for our MVP, targeting validated learning with these hypotheses:
- Hypothesis 1: Offering flexible KPI types (Count, Duration, SLA, Aggregation) would help users define business-relevant metrics.
- Hypothesis 2: A simpler KPI creation workflow would drive adoption.
MVP Features:
- Flexible KPI types: Count, Duration, SLA, Aggregation
- Simplified step-by-step KPI creation process
- Real-time calculation preview during setup
Excluded Features (Future Considerations)
- Dynamic attribute filtering (planned for later)
- AI-driven KPI suggestions (long-term goal)
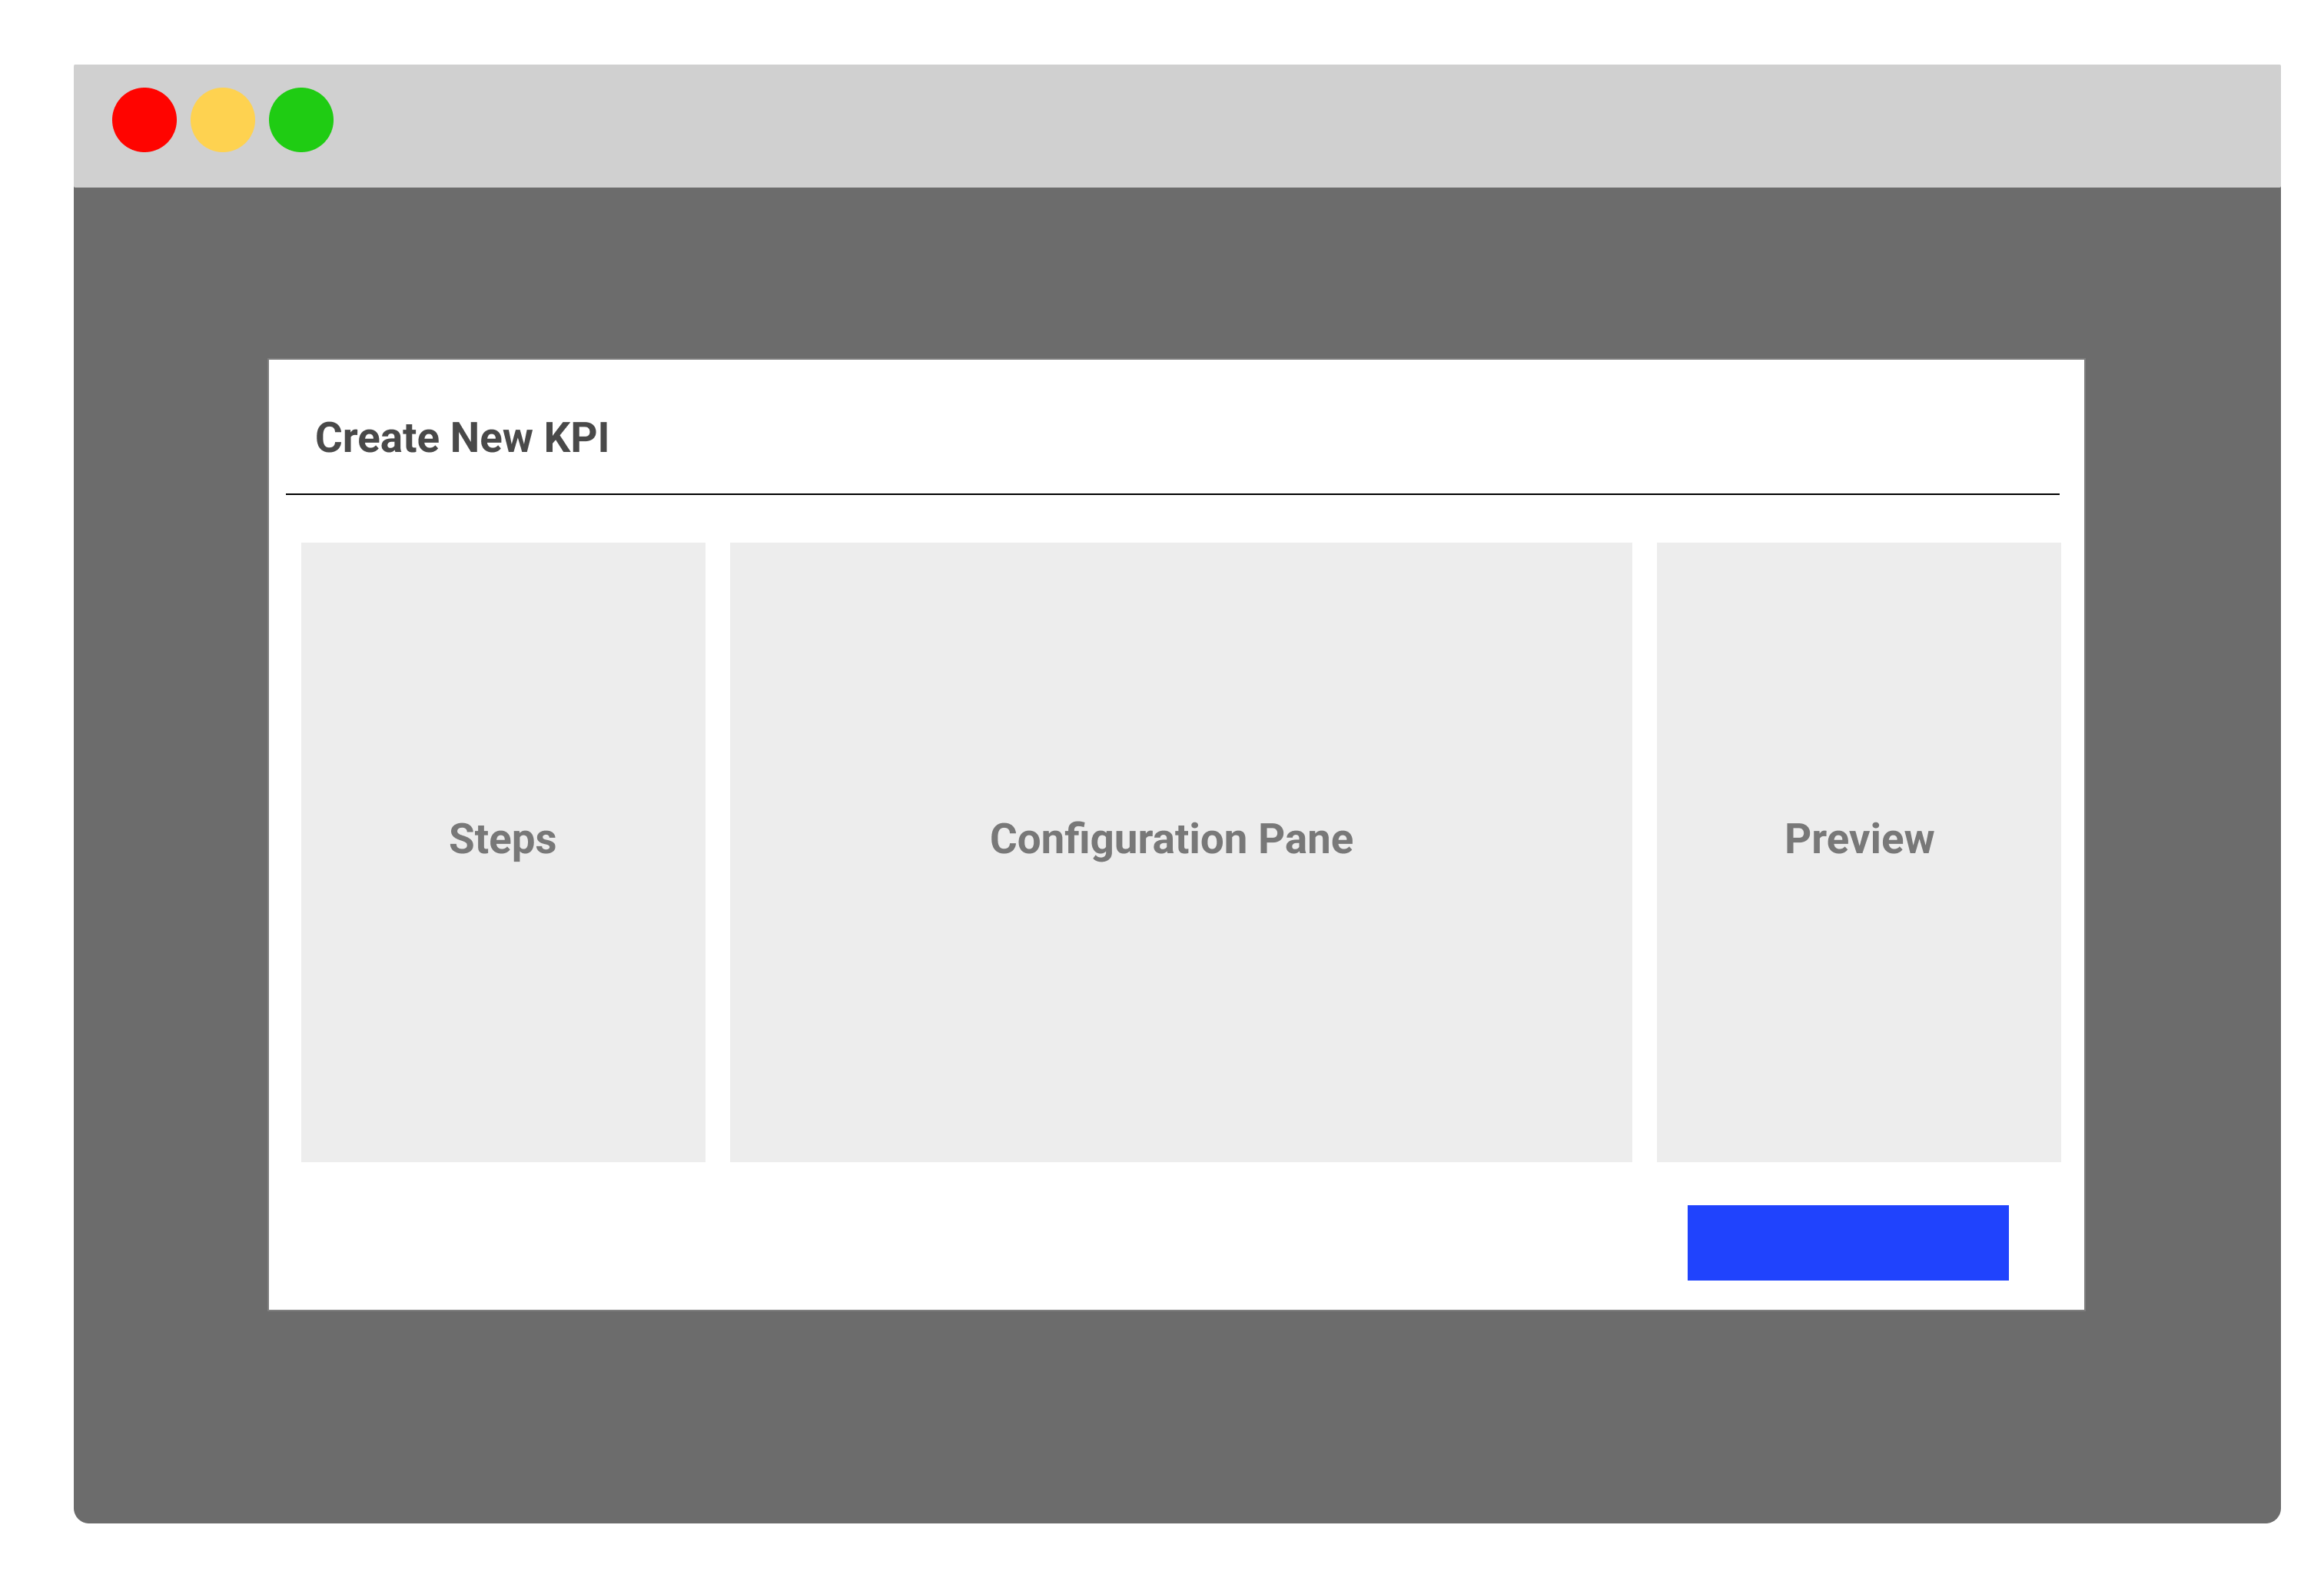
To quickly explore and test different ideas for KPI creation in Appian, I started with low-fidelity prototypes—mainly sketches and wireframes. This approach allowed me to iterate rapidly, gather feedback early, and make adjustments to ensure the design fit within Appian’s user experience guidelines and best practices.

Creation Flow Dialog
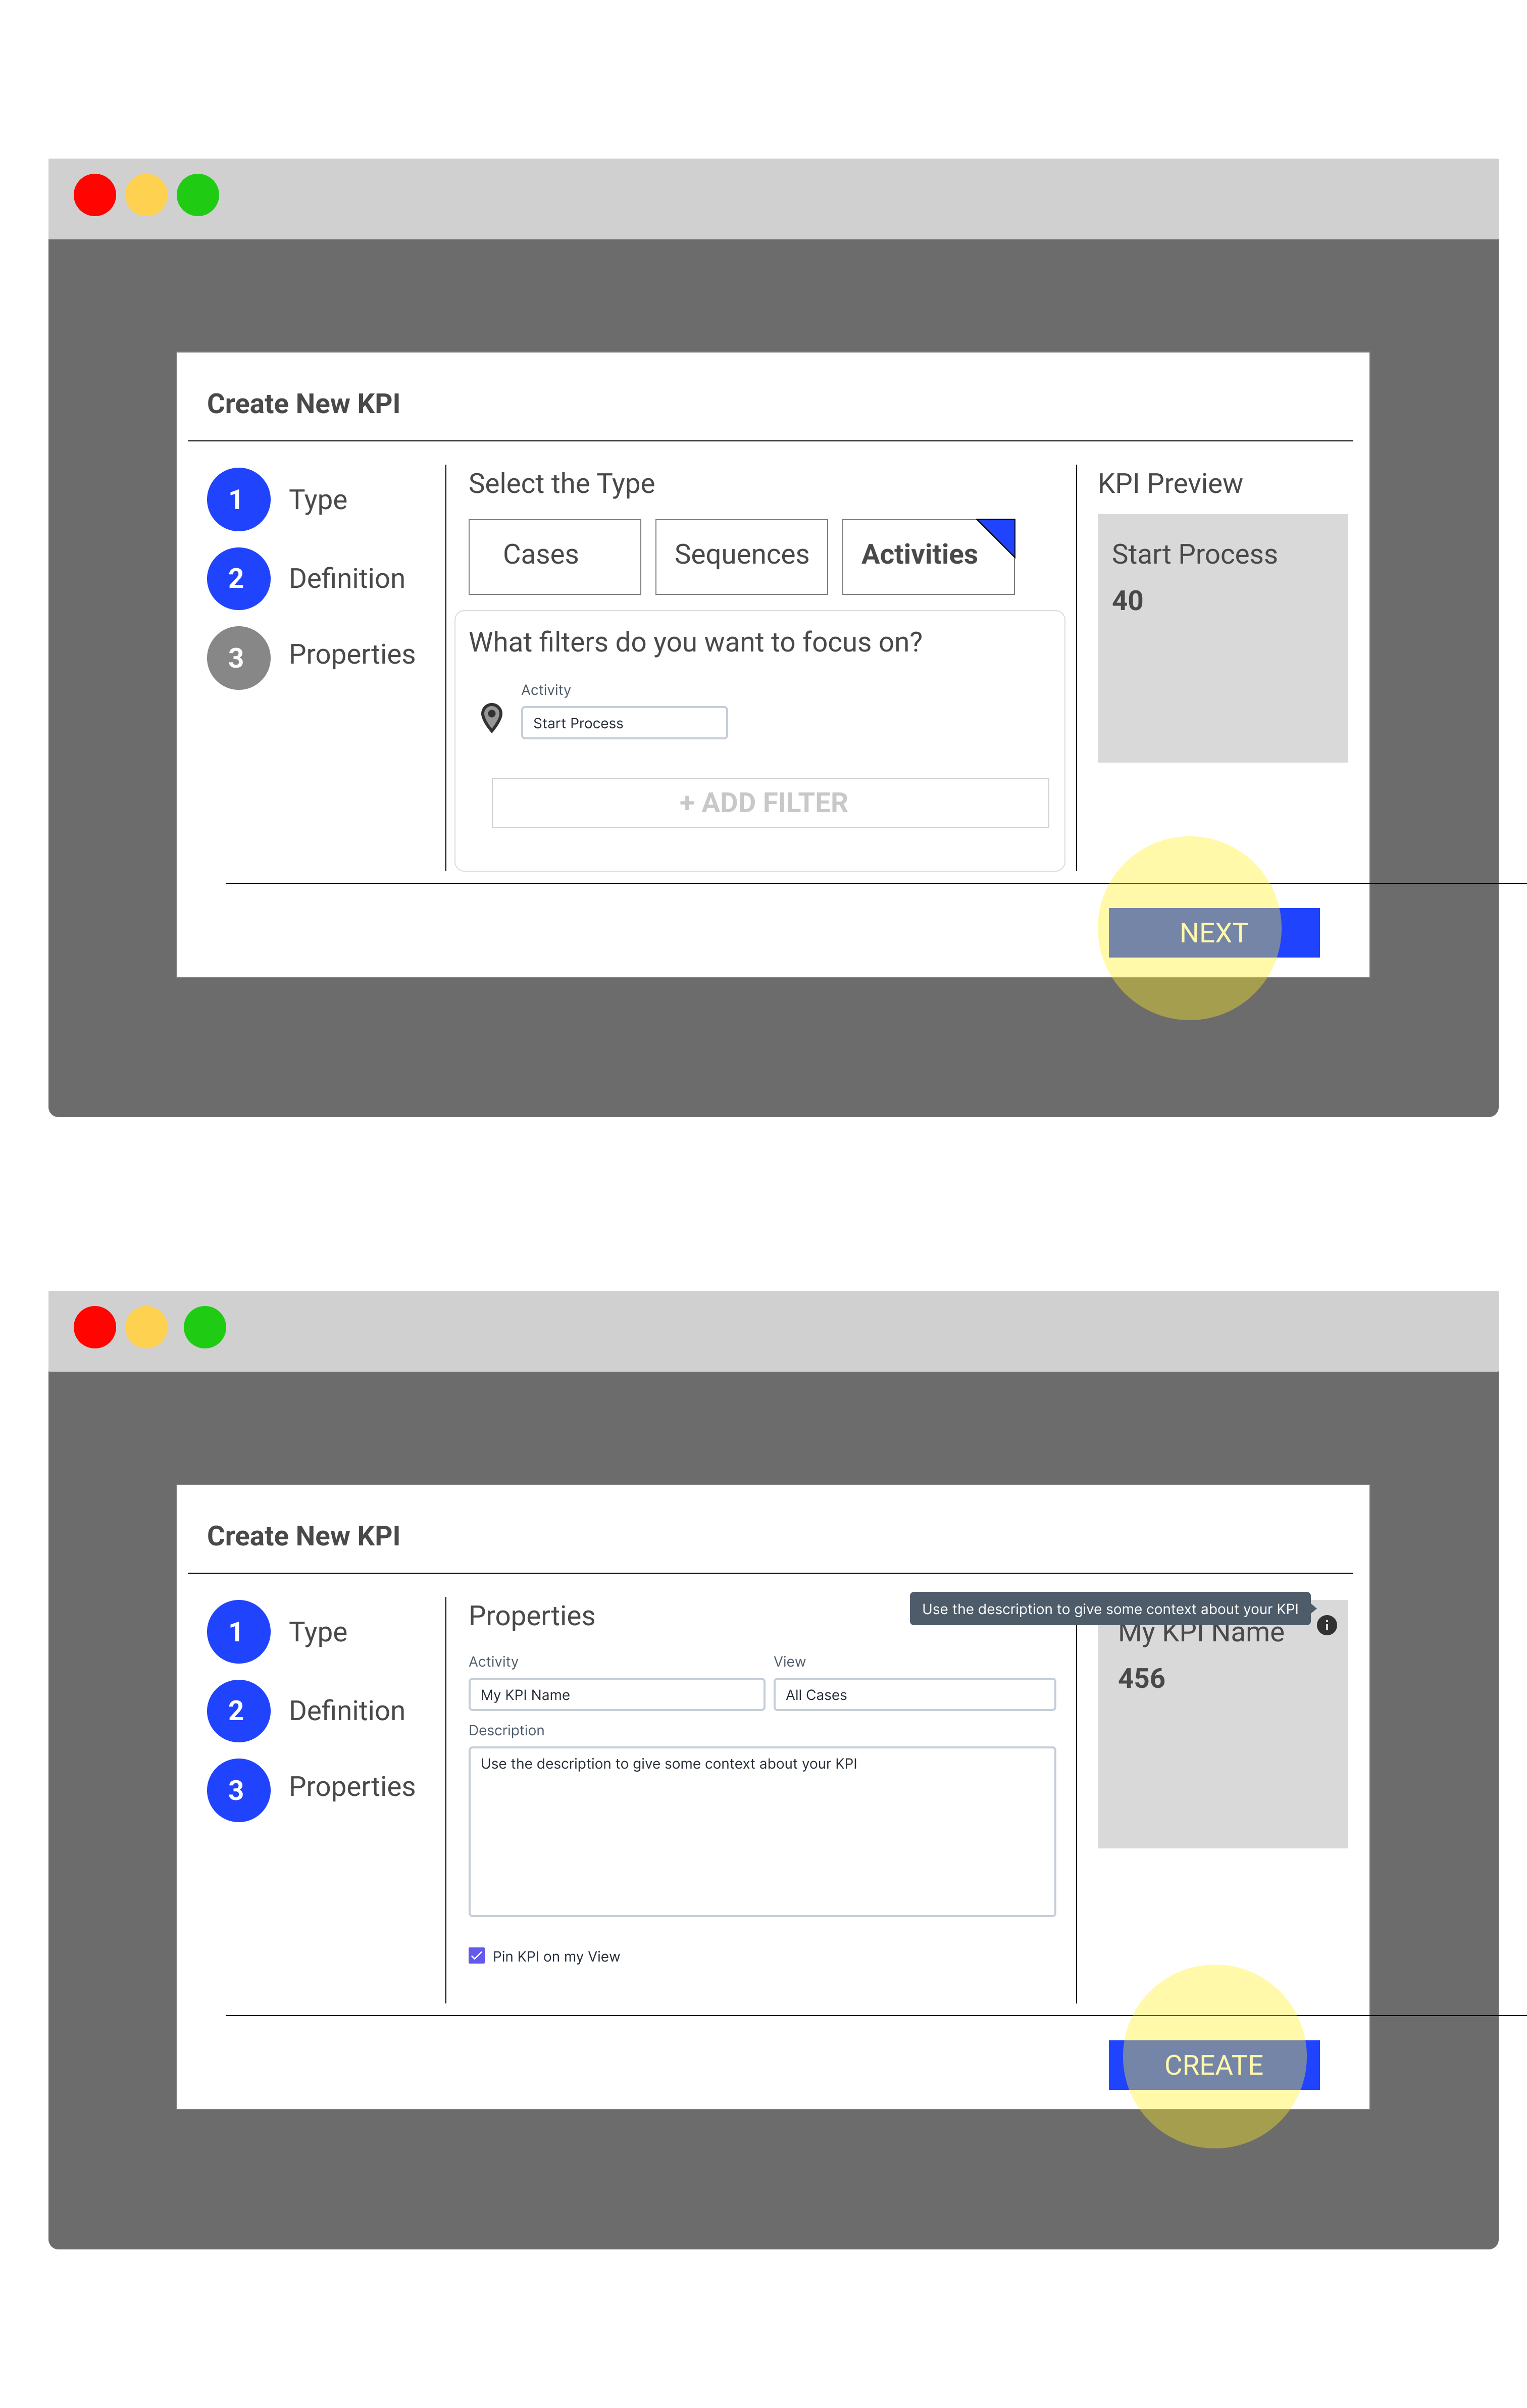
One of the first things we focused on was streamlining the KPI creation process. I suggested housing the entire creation flow in a dedicated dialog. This setup had a few key benefits:
- Minimizing disruption: Users wouldn’t need to leave their current workflow.
- Maintaining context: It kept the user focused on the task without unnecessary distractions.
Providing a better experience: The dialog created a dedicated, uncluttered space for KPI creation.

Key Step: Definition
The “Definition” step was especially important, so we worked closely with InfoDev to get the terminology just right. After exploring options like “KPI Filters” and “Configuration,” we landed on “Definition.” It felt the most intuitive to users and aligned well with how stakeholders described specifying KPIs.
The UI made heavy use of Appian’s a!cardChoice() component, which dynamically displayed options based on the type of KPI the user selected. For example, if they picked a “Duration” KPI, the component would show fields for start and end times while hiding irrelevant options. This approach tailored the experience to the user’s choices, keeping things simple and relevant.
KPI Preview
To make the process more transparent, I added a real-time KPI preview within the dialog. This let users see their configuration choices update dynamically, helping them understand how their KPI would look and function before saving it.
Pinning Behavior
Integrating pinning functionality was a bit tricky at first. We considered adding a “Pin” button directly in the dialog, but during testing, users made it clear they wanted something more intuitive.Based on their feedback, we introduced default pinning for newly created KPIs. Now, when a user creates a KPI, it’s automatically pinned to the current view, making it easy to find later. If they don’t want it pinned, they can unpin it with just a click—giving them flexibility without extra steps.
One of the first things that stood out during this phase was how complex the KPI management interface could get. Managing and organizing a growing number of custom KPIs within Appian had the potential to become overwhelming and cluttered for users.
To tackle this, I suggested a simplified MVP approach to Franziska (Product Owner): instead of tackling everything at once, we’d focus first on an “Add Existing KPI” action. This would trigger a dialog where users could easily see and select KPIs available for the current process view. By focusing on this, we could address the core need—helping users access and use KPIs—while keeping the interface clean and straightforward.
When designing the dialog for selecting and adding KPIs, we ran into a critical question: how granular should the KPI types be? For example, should SLA be treated as its own KPI type or just a variation of a Count KPI with a defined threshold? This sparked some deeper discussions about the boundaries between different types like Duration, Count, Aggregation, and SLA, which highlighted the complexity of the system we were designing for.
These early prototypes and conversations with stakeholders were essential. They helped us uncover potential pain points, refine the direction, and ensure that our design choices aligned with user needs. The feedback from this phase shaped the next steps, ultimately leading to a solution that felt intuitive while enhancing the user experience within Appian.


Yi-Ann Chen
UX Designer at Google
“While working at Appian with Javier I could see how in his work he is very independent, reaches out at any moment when he needs one’s input and drives his work with deepest passion and structure and is highly determined and focused on his mission for creating a great user experience and designs for our users.“
Let’s work together on your
next web project
Send a message and let’s start shaping the future of your product.


